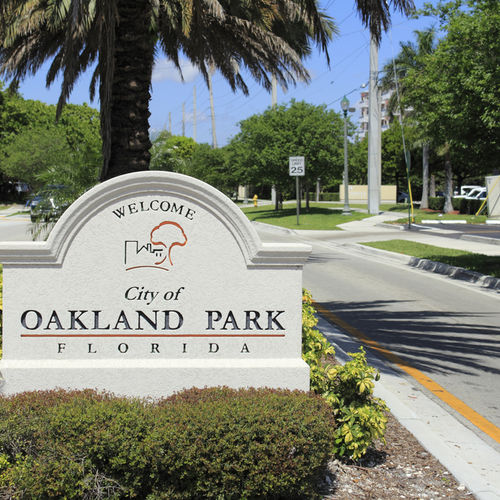

Fort Lauderdale, Oakland Park, and Wilton Manors Housing Market Update: June 2026 vs June 2025
If you're buying or selling in Northeast Fort Lauderdale, Oakland Park, or Wilton Manors right now, the headlines about "the Florida market" don't tell you much. Each of these three cities is doing something different this year, and the difference matters if you're setting a price or writing an offer.
Here's what the June 2026 numbers actually show, city by city, based on closed sales compared to the same month last year.
What's Happening in the Fort Lauderdale Housing Market Right Now?
Fort Lauderdale had more sales this June than last, up 21.3% to 359 closings. That's a real jump in activity. But the median closed price actually dipped slightly, down 1.8% to $537,500. Buyers are out there and deals are getting done, they're just not chasing the price up.
Inventory is where it gets interesting. Active listings dropped 13.7% year over year, and months of supply on closed sales fell from 10.6 to 7.6, a nearly 30% tightening. That's a market shifting away from buyer-friendly territory. Homes are still sitting an average of 87 days, unchanged from last year, but new listings are coming in priced much higher, with the median new listing up over 21% to $672,500.
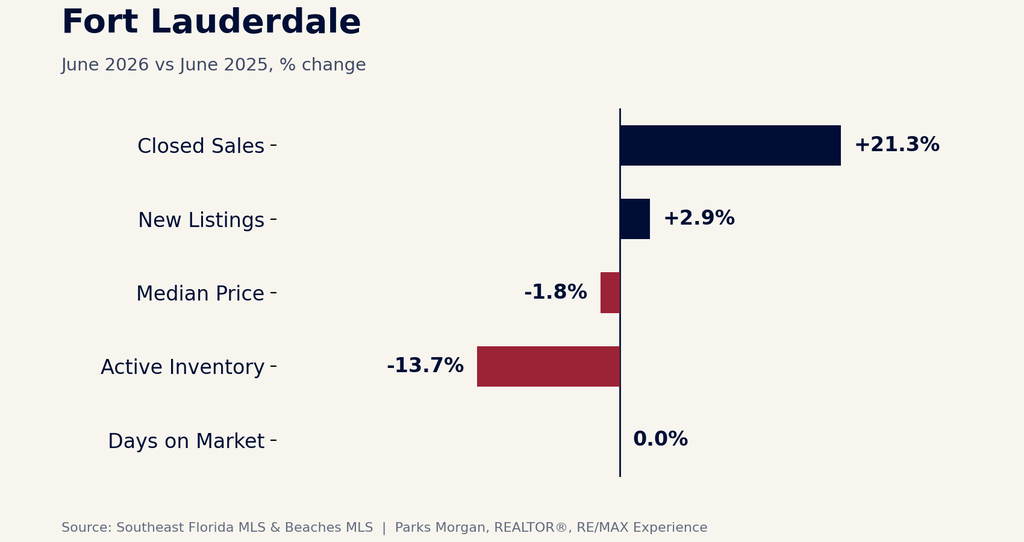
Fort Lauderdale home sales climbed 21.3% year over year in June 2026, even as inventory tightened and prices held nearly flat.
The takeaway: sellers have more room to price with confidence than they did a year ago, but buyers should know the easy leverage of last summer is fading.
Is Oakland Park's Housing Market Cooling or Heating Up?
Oakland Park is the clearest case of a tightening market. Closed sales dropped 21.5% to 51 homes, and new listings fell 7.1% too. Fewer homes changed hands. At the same time, the median closed price jumped 21.8% to $487,000, and homes sold in 61 days on average instead of 79, a 23% improvement.
Sold-to-list price ratio also ticked up to 96.04%, meaning homes that do sell are getting closer to full asking price. Put together, this looks like a market with fewer transactions but stronger footing under each one. Inventory fell over 22%, so there simply isn't as much to choose from.
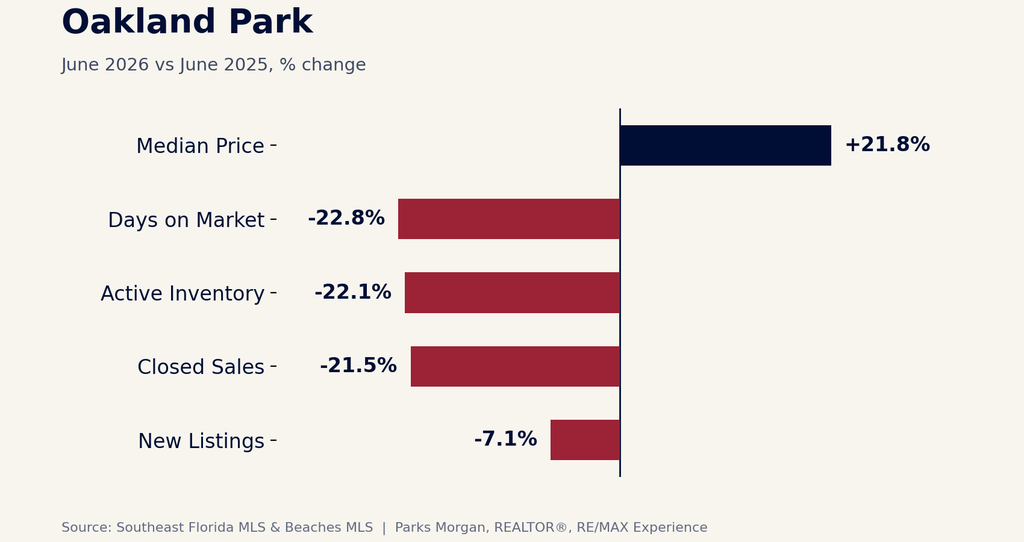
Oakland Park home prices jumped 21.8% year over year in June 2026 as inventory and days on market both tightened sharply.
The takeaway: if you're selling a well-maintained home in Oakland Park, this is a strong window. If you're buying, expect less to choose from and less negotiating room than last year.
Why Are Homes Taking Longer to Sell in Wilton Manors?
Wilton Manors tells a different story. Closed sales were down 8.8% and median price rose modestly to $715,000, up 1.8%. The number that stands out is days on market, which jumped from 76 to 100 days, a 31.6% increase. Homes are simply taking longer to find a buyer than they did last summer.
Meanwhile, sellers are coming to market more optimistic than ever. New listings rose 24.3%, and the median new listing price climbed to $766,500, up nearly 10%. That gap, between what sellers are asking and how long it's taking to sell, is the thing to watch. Sold-to-list held fairly steady near 89.5%, so pricing discipline still matters more than ever here.
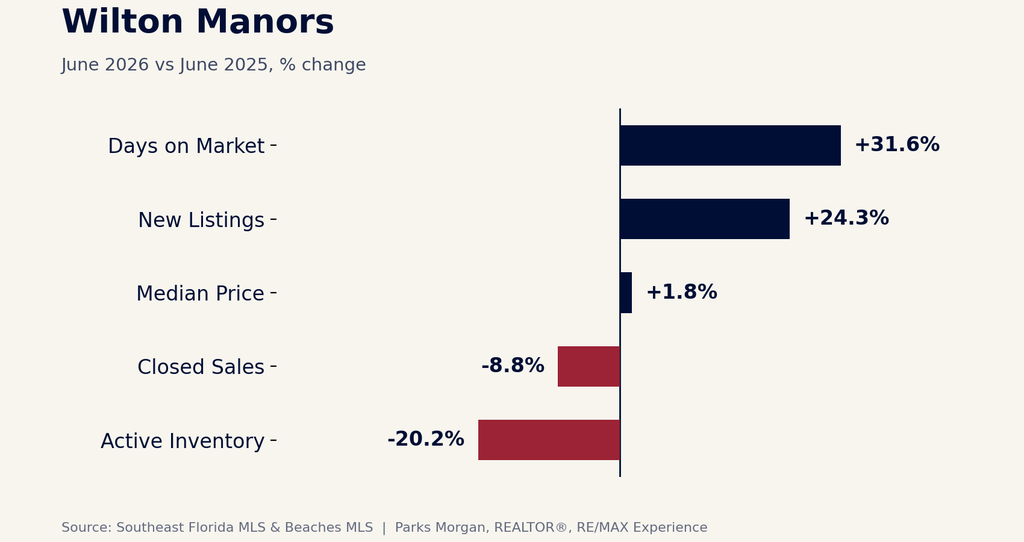
Wilton Manors homes took 31.6% longer to sell in June 2026 even as sellers listed at higher asking prices.
The takeaway: Wilton Manors sellers who price against last year's expectations risk sitting on the market. A realistic, data-backed price at listing is doing more work than it used to.
Quick Comparison: June 2026 vs June 2025
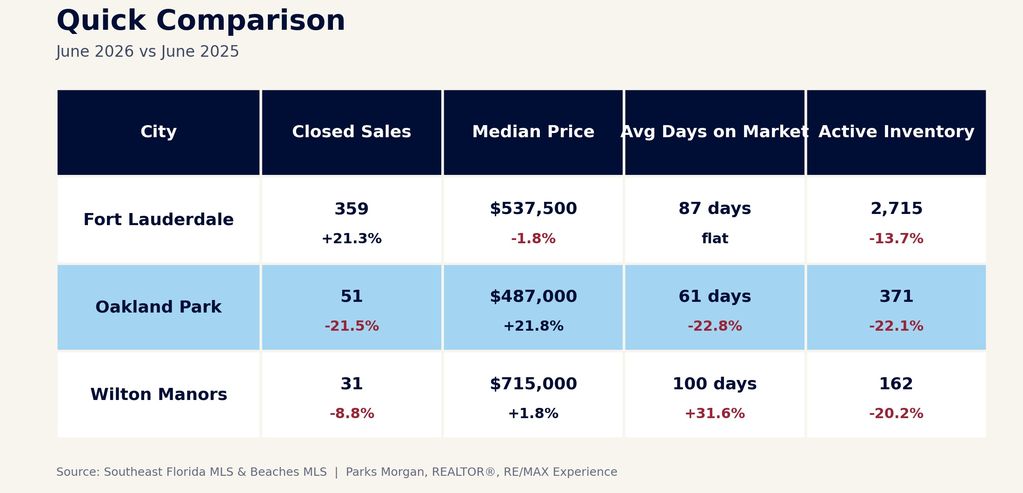
A side by side look at how Fort Lauderdale, Oakland Park, and Wilton Manors compared in June 2026 versus June 2025.
What Does This Mean If You're Buying or Selling in Northeast Fort Lauderdale?
No two of these cities are moving the same way this summer. Fort Lauderdale is seeing more volume with prices holding steady. Oakland Park has fewer sales but stronger pricing power for sellers. Wilton Manors needs the most careful pricing strategy of the three, given how much longer homes are taking to sell.
If you're weighing a move in any of these three cities, the strategy that worked in 2025 probably isn't the strategy for 2026. I work these streets every day, Coral Woods, Coral Terrace, and the surrounding neighborhoods, and I can walk you through what these numbers mean for your specific address.
Reach out if you want a pricing conversation grounded in what's actually happening on your block, not just the county-wide averages.
Data source: Southeast Florida MLS & Beaches MLS, closed sales June 1 to June 30, 2026 vs. June 1 to June 30, 2025.
Check out this article next